


NIT Rourkela Admission 2026: Cutoffs, Placements, Branch-Wise Salary & ROI Analysis
For engineering students preparing for NIT Rourkela Admission 2026, choosing the right NIT is often more complex than just going for a brand name. NIT Rourkela is often considered an upper-tier institution. What does the data actually show?
This Story also Contains
- NIT Rourkela Institutional Profile: Seats, Diversity, and Faculty Strength
- NIT Rourkela Closing Rank Cutoff (Outside Home State)
- NIT Rourkela Placement Statistics (NIRF Data Analysis))
- Branch-Wise Placement Report 2023–24: CSE vs Core Engineering
- Recruiter Mix at NIT Rourkela: Tech, Consulting, Core & PSU
- Conclusion

If we observe the admissions, branch-wise cutoffs, placement performance, recruiter range, and alumni outcomes, there is a strong institutional preference. With increasing salaries, there is a variation at the branch level when it comes to starting salaries and placements.
NIT Rourkela Institutional Profile: Seats, Diversity, and Faculty Strength
The institution was established in 1961 as REC Rourkela and was declared an NIT in 2002. It is an Institute of National Importance. There are several degrees that the institute provides, such as B.Tech, B.Arch, M.Tech, M.Sc, MBA and PhD programmes.
| Parameters | Data |
|---|---|
Estd Year | 2002 |
Institute Type | INIs |
Campus Size | 647 Acres |
Total Students (UG 4Yrs) | 4,126 |
Total Male (UG 4Yrs) | 3,303 (80%) |
Total Female (UG 4Yrs) | 823 (20%) |
Outside State (UG 4Yrs) | 1,929 (47%) |
Within State (UG 4Yrs) | 1,917 (46%) |
Outside Country (UG 4Yrs) | 280 (7%) |
Total faculty | 403 |
NIT Rourkela Closing Rank Cutoff (Outside Home State)
The cut-off is for students who do not belong to the home state. The cut-off data gives students an understanding of branch-level demand across categories. A lower cut-off rank is indicative of higher competition and stronger student preference. Courses such as computer science and new-age tech streams dominate. On the other hand, core and specialised branches seem to have a lower competitive pressure.
| Course | Open | EWS | OBC-NCL | SC | ST |
|---|---|---|---|---|---|
3431 | 438 | 1214 | 409 | 230 | |
4448 | 538 | 1454 | 880 | 313 | |
5785 | 748 | 2131 | 1169 | 465 | |
9555 | 1265 | 3932 | 1921 | 585 | |
10623 | 1528 | 4051 | 2033 | 912 | |
18034 | 3008 | 6935 | 3815 | 955 | |
24030 | 4662 | 8579 | 5540 | 1930 | |
24786 | 3929 | 11164 | 4016 | 1501 | |
25282 | 3729 | 8296 | 4293 | 1025 | |
30135 | 4875 | 9868 | 5761 | 2128 | |
32227 | 5252 | 11290 | 5323 | 11131 | |
B.Tech Ceramic Engineering | 34022 | 4973 | 10250 | 6325 | 2402 |
34766 | 5384 | 13278 | 6811 | 2044 | |
35731 | 5123 | 10527 | 5250 | 1011 | |
40010 | 6257 | 13777 | 6512 | 2685 |
CSE and AI are quite popular among students who are not from the home state. Branches such as Electrical and Chemical engineering have mid-level competitiveness. Interdisciplinary programmes have a limited interest.
NIT Rourkela Placement Statistics (NIRF Data Analysis))
Category | 2019 -2022 | 2020 -2023 | 2021 -2024 |
|---|---|---|---|
Admitted | 823 | 1,007 | 1,131 |
Graduated | 712 | 910 | 1,011 |
Placed | 640 | 795 | 821 |
Opt for HS | 15 | 40 | 128 |
Placement % | 91.82% | 91.38% | 92.98% |
Median CTC | 10,00,000 | 12,50,000 | 15,25,000 |
Admission vs Placement Gap: Should Aspirants Be Concerned?
The steady and stable rise in median salary, from Rs. 10 lakh to Rs. 15.25 lakh, marks increasing compensation outcomes. However, there is a cause for concern. In the 2021-24 batch 1,131 students got admission, out of which 821 got placements. 310 students (27 per cent) did not get campus placements.
There is a similar gap in previous batches as well, and is often overlooked when the placement data is considered of those students who registered for the placement. Over the years, this gap has widened.
Branch-Wise Placement Report 2023–24: CSE vs Core Engineering
A proper scrutiny at branch-wise placement percentages and salary outcomes reveals variations in employability trends, market demand, and possible compensation. The following table presents placement rate, average, median, and highest CTCs across major engineering branches, offering a clearer understanding of how outcomes differ within the same institution.
| Branch | % Placed | Average CTC (LPA) | Median CTC (LPA) | Highest CTC (LPA) |
|---|---|---|---|---|
Civil Engineering | 55.77% | 8.33 | 7.00 | 23.5 |
Computer Science and Engineering | 75.41% | 17.89 | 14.63 | 64 |
Electrical Engineering | 78.38% | 10.50 | 8.05 | 47 |
Electronics and Communication Engineering | 69.64% | 14.65 | 14.48 | 37.5 |
Mechanical Engineering | 83.65% | 10.59 | 8.50 | 27 |
Observation: Placement results vary across branches. Mechanical Engineering has the highest placement rate (83.65 per cent), followed by Electrical (78.38 per cent). CSE has the leads highest average (Rs.17.89 LPA) and the highest package (Rs.64 LPA). ECE shows stable median pay. If we look at civil engineering, it has a lower placement rate (55.77 per cent) and lower salaries.
Recruiter Mix at NIT Rourkela: Tech, Consulting, Core & PSU
NIT Rourkela’s recruiter pool reflects a diversified hiring ecosystem that includes technology, core engineering, consulting, finance, and public-sector research organisations. With key participation from global tech firms, manufacturing giants and consulting majors, the institute does not depend on just one industry.
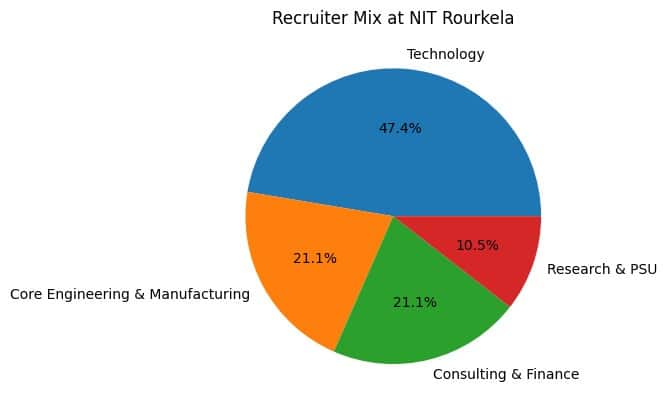
Observation: Tech companies have the highest share of recruiters. There is a significant demand for coding, analytics, and product-oriented roles. Engineering and consulting recruiters ensure varied career pathways. Students have the option to choose technical, managerial, and research-driven careers.
Alumni Distribution
This consolidated graph presents NIT Rourkela’s currently employed alumni across nine major global companies, combining data from both LinkedIn alumni tables. It reflects how the alumni is spread across consulting, semiconductor, cloud, and tech firms.
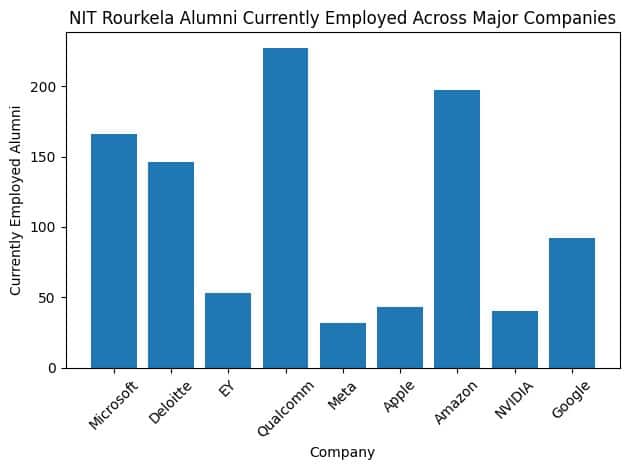
Alumni Footprint: Where NIT Rourkela Graduates Work Globally
Qualcomm (227) and Amazon (197) have the highest alumni. This is an indicator that there is a strong presence in semiconductor and large tech ecosystems. Microsoft (166) and Deloitte (146) also show strong representation. Google (92) has a moderate presence. Meta, Apple, NVIDIA, and EY have smaller numbers. What this indicates is that the alumni have a stronger presence in core technology and large enterprise firms than in social media or pure consulting firms.
Conclusion
NIT Rourkela is considered one the top NITs. The highest placement offer was Rs. 64 LPA with a strong tech presence and a wide alumni network. What students need to understand is that placement outcomes change across branches. What students want from their careers, whether they want good placements or want more research-oriented job roles, branch selection is probably more important than the institute’s name.

List of Related colleges
Questions related to NIT Rourkela
On Question asked by student community
Hey folk,
Hope you are fine.
Getting the cutoff marks for the mechanical engineering for the csab round of the nit rourkela will be too early to get. You can check the previous year cutoffs and the opening and closing ranks of the various courses and the programs by visiting
There are low chances of getting a seat in nit rourkela with josaa couselling but u can go for csab couselling .
Beside nit rourkela u can also consider other nits and iiits
Dear
According to the information based on your rank, it is possible to get admission into NIT Rourkela, especially since you are from the home state. However, the exact branch you get will depend on the cutoff ranks for each branch and the availability of seats.
For 2024, the cutoff
Dear
According to the information with an overall score of 93.84 percentile in JEE Mains 2024 and an OBC-NCL rank of 29,000, getting into NIT Rourkela is definitely a possibility, especially since it's your home state institute. However, the final cutoffs can vary each year based on the number of
Dear
According to the information with a general EWS rank of 15,000, getting admission to NIT Rourkela is quite possible! NIT Rourkela's cutoffs for the general EWS category can vary each year, but a rank of 15,000 should place you in a good position for several branches.
For finding the